
Ride files in interactive 3D, a living map of all 95 acres, and the data the park doesn't publish — the unofficial Lagoon fan guide, made by people who live down the street.




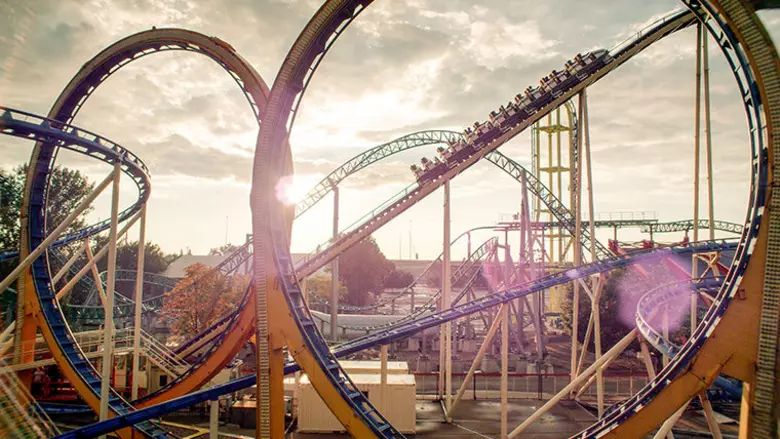
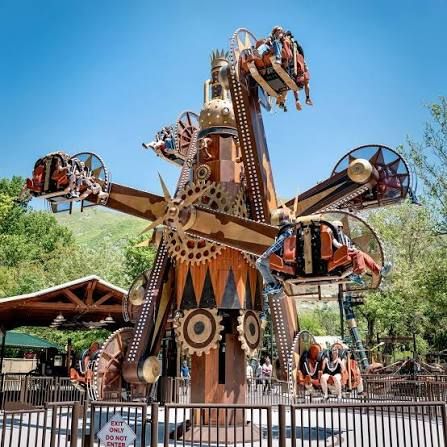
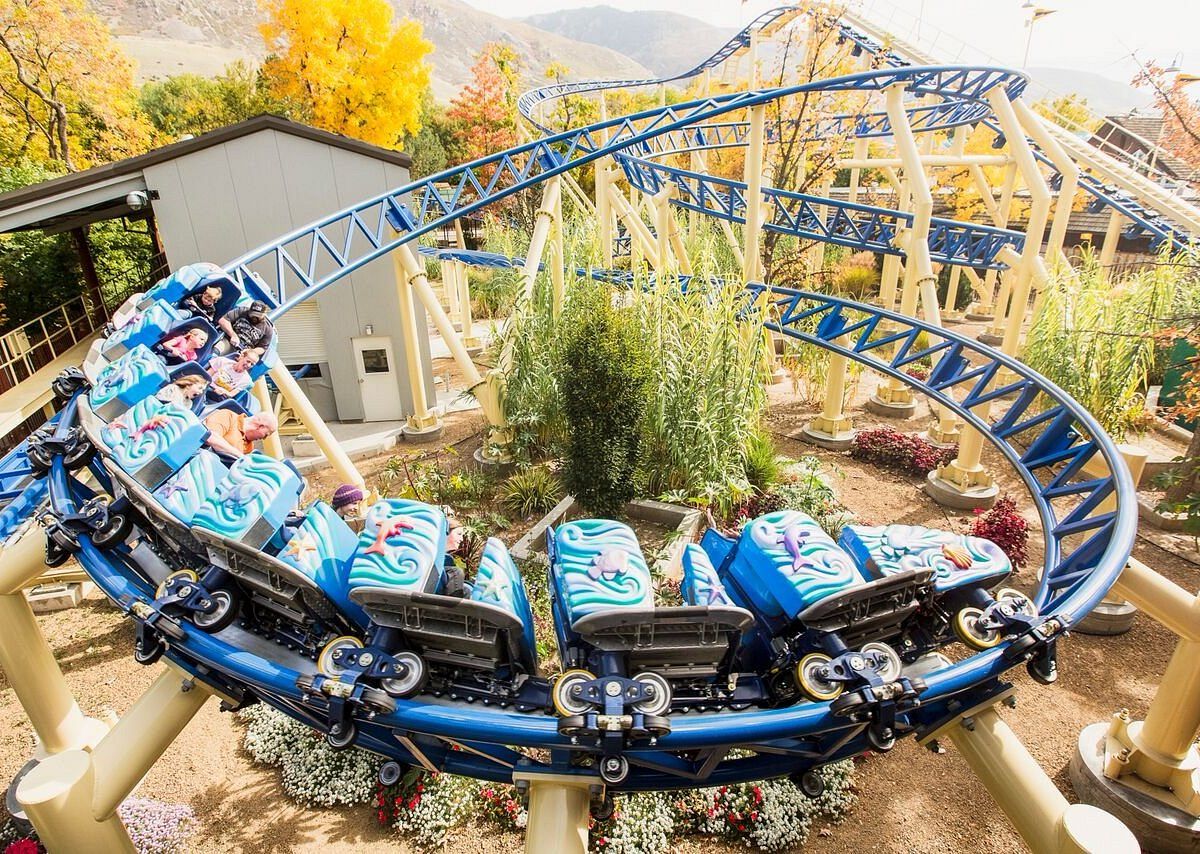
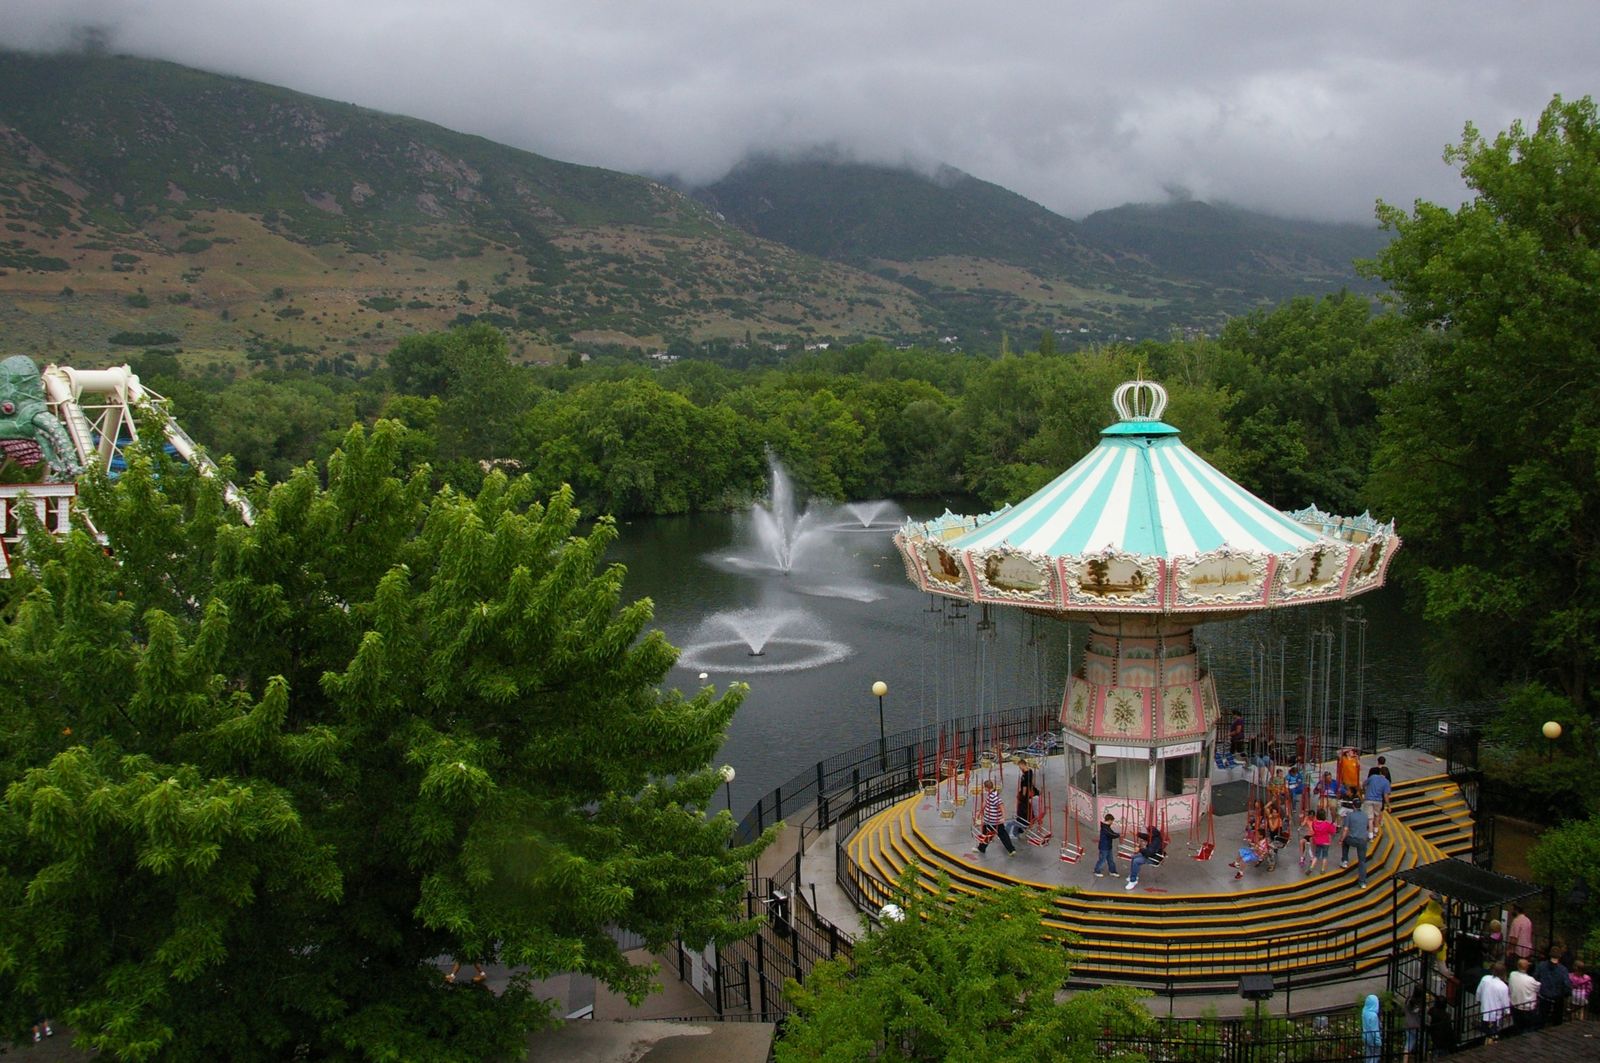
Every ride, path, pond, and food stand — 93 pins in tilting 3D, with a satellite view and photos on tap. Built on open data, refined every week.
Open the Map
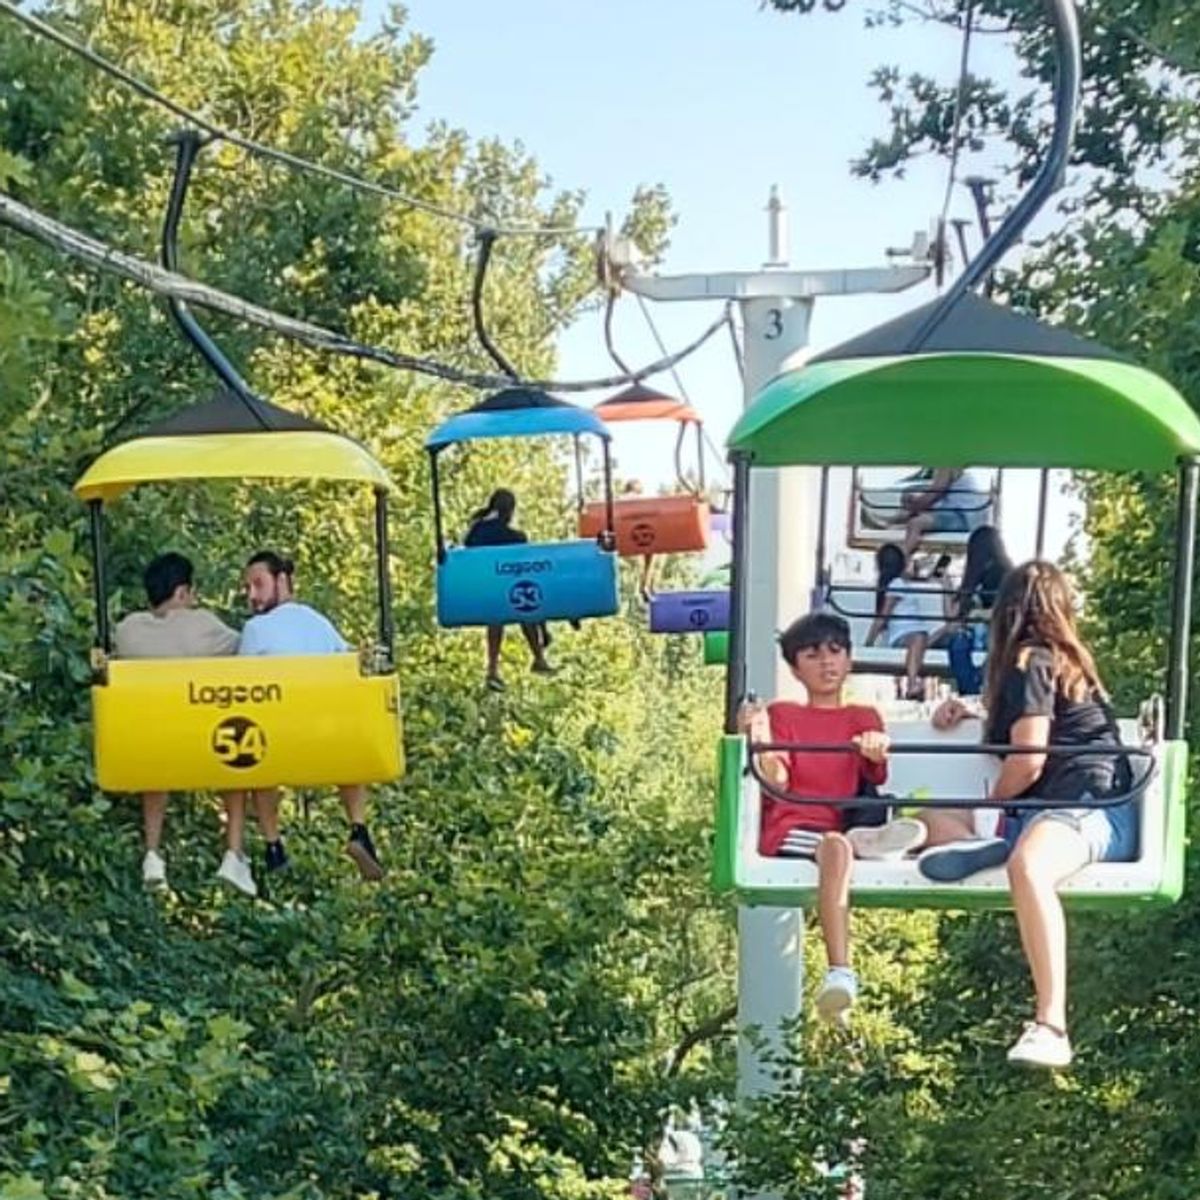
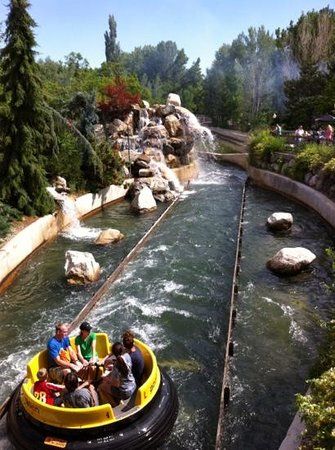
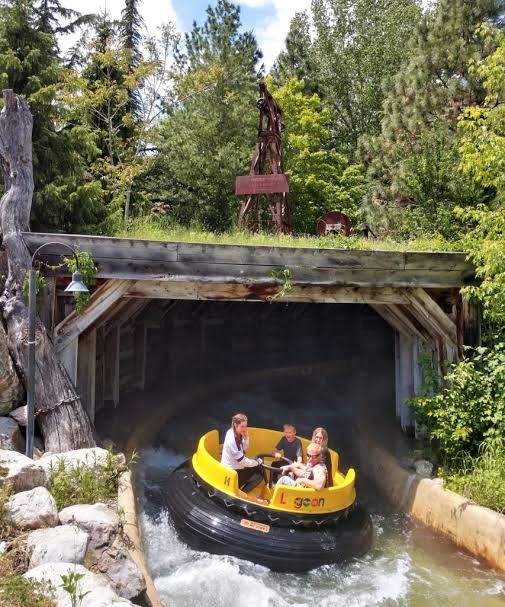
Which days are packed, which are walk-ons, and why. A crowd model built on school calendars, weather, seasons, and boots-on-the-midway logging — plus community-reported wait times.
Blender models, Planet Coaster recreations, NoLimits track work — the Lagoon recreation scene finally gets a masthead. Artist-credited, interactive where possible.